Analysing the order parameter of the Kuramoto model can provide a vast amount of information about it's dynamics.
 For instance, considering a plot of the modulus of the order parameter r as one varies the coupling constant K provides an easy method of estimating the critical value Kc.
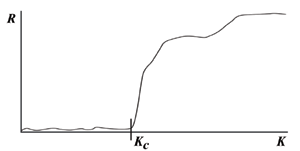
The graph to the left plots r as we steadily increase the value of K over a long time period in a typical simulation where n → ∞. For small Kc, r remains small as the oscillators move near to their own natural frequencies. As K increases past Kc, there is a sudden increase in r as the oscillators 'snap' together and enter synchrony [8].

The second plot (right) shows two typical time series for r. When K > Kc the r very quickly tends to 1, indicating that the system exhibits synchronous behaviour. When K < Kc, even though the oscillators begin close together, r drops rapidly. In this case we see a lot of random variation of r as the oscillators may naturally move closer together at periods of time without synchronous behaviour [8].
The graph to the left plots r as we steadily increase the value of K over a long time period in a typical simulation where n → ∞. For small Kc, r remains small as the oscillators move near to their own natural frequencies. As K increases past Kc, there is a sudden increase in r as the oscillators 'snap' together and enter synchrony [8].
The second plot (right) shows two typical time series for r. When K > Kc the r very quickly tends to 1, indicating that the system exhibits synchronous behaviour. When K < Kc, even though the oscillators begin close together, r drops rapidly. In this case we see a lot of random variation of r as the oscillators may naturally move closer together at periods of time without synchronous behaviour [8].


